Gantt Chart
The Gantt chartGantt chartA timeline view for long-term project planning, showing tasks, durations, dependencies and milestones. is the planning surface for projects. Where the planning board handles one-off tasksTaskA unit of work that belongs to a job. It appears in the open task list until it is scheduled to a resource. dropped onto a resource'sResourceAn entity that can carry out work - a person, vehicle, tool, or room - that you schedule on the planning board. day, the Gantt chart deals with multi-task work that has shape: phases, dependencies, deadlines, baselines, and dozens or hundreds of related steps.
A construction project is the textbook example. Architectural design has to finish before construction starts, the foundation has to be poured before walls go up, and walls have to go up before the roof. Each phase contains its own breakdown of work, each task has resources, each task has a deadline. Without a Gantt view, the project manager has no way to see the shape of all that, no way to reason about what slips when a dependency moves, and no way to commit a coherent plan to the rest of Dime.Scheduler. The Gantt chart solves exactly those problems: it shows the project as a single tree of tasks on a timeline, lets the project manager reshape that tree freely, and only then materializes the result as appointmentsAppointmentA task scheduled to a resource for a specific period - the scheduled instance you see on the planning board. on the planning board.
What ends up here
Projects and their tasks are created in the back-office application; Dime.Scheduler plans them, it does not create them. You bring a project into the chart in one of two ways:
-
From the Gantt itself with the load-project icon
 , which opens a window listing every available project.
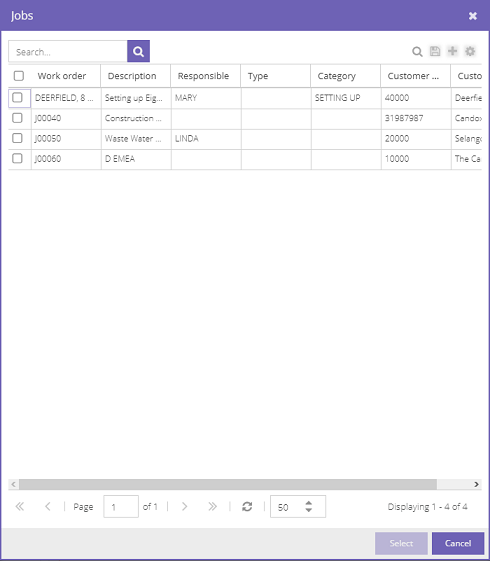
-
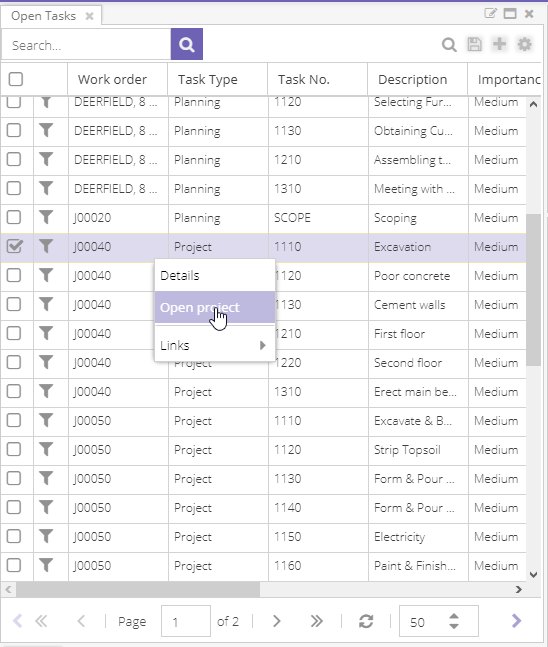
From another component's context menu. Project tasks in the open tasks, planned tasks, and route sequence grids carry an "Open project" item that drops you straight into the Gantt with the project loaded. The "Task Type" column distinguishes planning tasks from project tasks at a glance.
A loaded project unfolds across three areas: a task list on the left (the work breakdown), a timeline on the right (the bars), and a toolbar above with views, dates, baselines, and the sync controls that protect your changes.
Reading the project
Looking at a project is a separate skill from editing it, so the toolbar opens with a row of tools dedicated to seeing.
![]()
A zoom-to-fit button squashes the entire project into the visible range, useful as a reset after deep navigation. View buttons jump the start of the visible range to today, the start of the current week, or the start of the month, and switch between time scales: day, week, month, quarter, year. A local date picker filters the timeline without affecting the rest of the workspace. Two shift buttons walk the timeline forward and back. A row-height button accommodates dense projects.
When the noise of all the tasks gets in the way, several lenses help the project manager focus on what matters.
Critical path
The critical path is the chain of tasks that, if any one slips, pushes the project's end date. The longer the critical path, the more fragile the schedule, so it doubles as a risk readout: a long red line means tight slack everywhere.
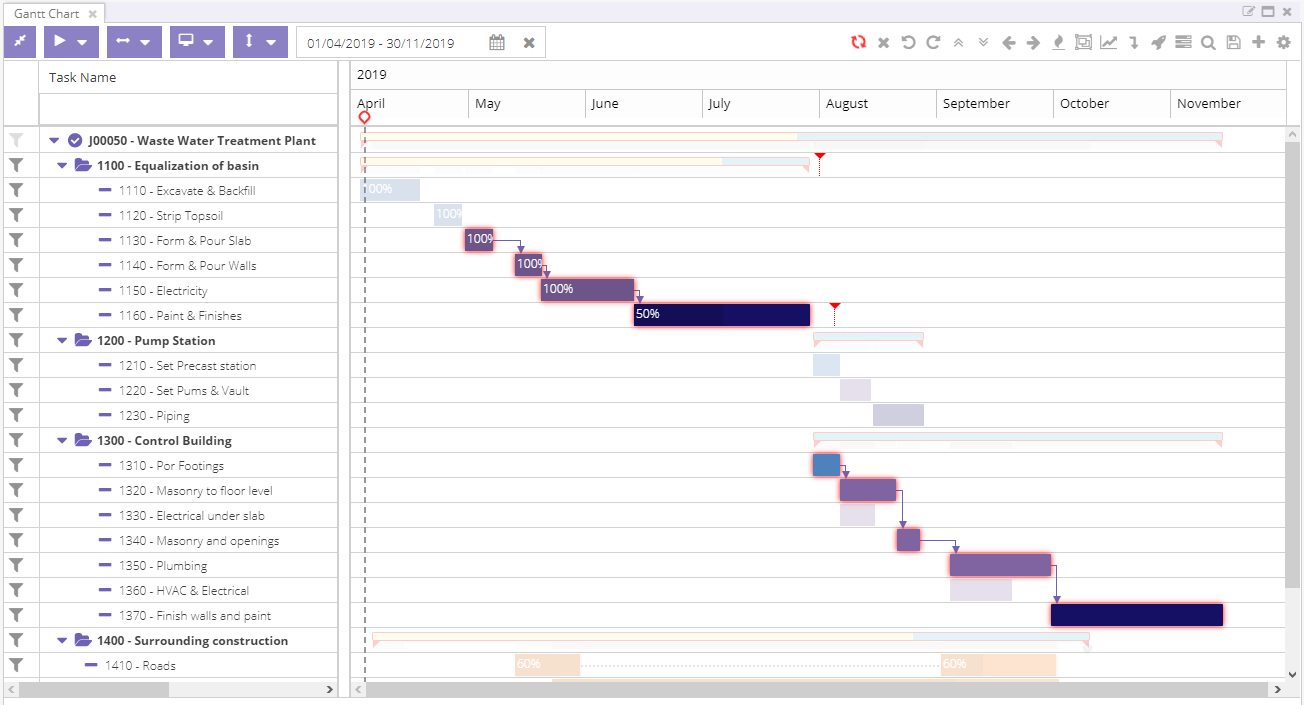
Progress
Progress evaluates each task against today's date and draws a red line per task: a line to the right of "today" means the task is ahead of schedule, a line to the left means behind. Project managers update the percentage in the task editor or by dragging the small circle on a selected task.
Baseline
The baseline is the original plan, frozen at sync time. Toggle it on and the baseline bars appear underneath the current ones; that's how a project manager sees a slip without having to remember what the plan used to look like. Without baselines, there is no reliable way to answer "how far have we drifted?"

Task groups
The task-groups toggle shades the work-breakdown structure so phases are obvious at a glance. Useful in long projects where the hierarchy alone is hard to follow scanning down the list.
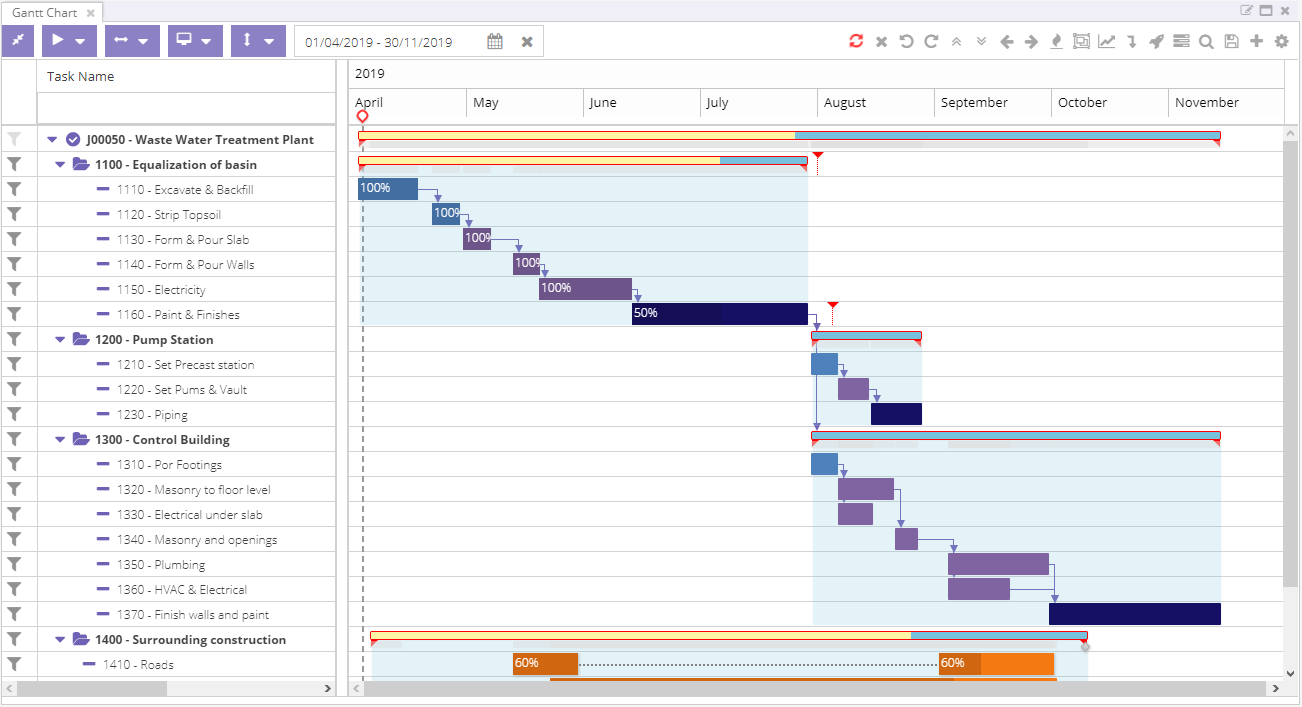
Rollup
Rollup controls whether subtask detail aggregates up to the summary bar. The button on the toolbar applies the project-wide default; the per-task Rollup checkbox in the task editor overrides it for one task at a time.
Locate project
After scrolling through dates or filtering the date range, you can lose sight of the overall project. The crosshair icon snaps the view back to the project's start date without disturbing the view mode or zoom level.
Reshaping the plan
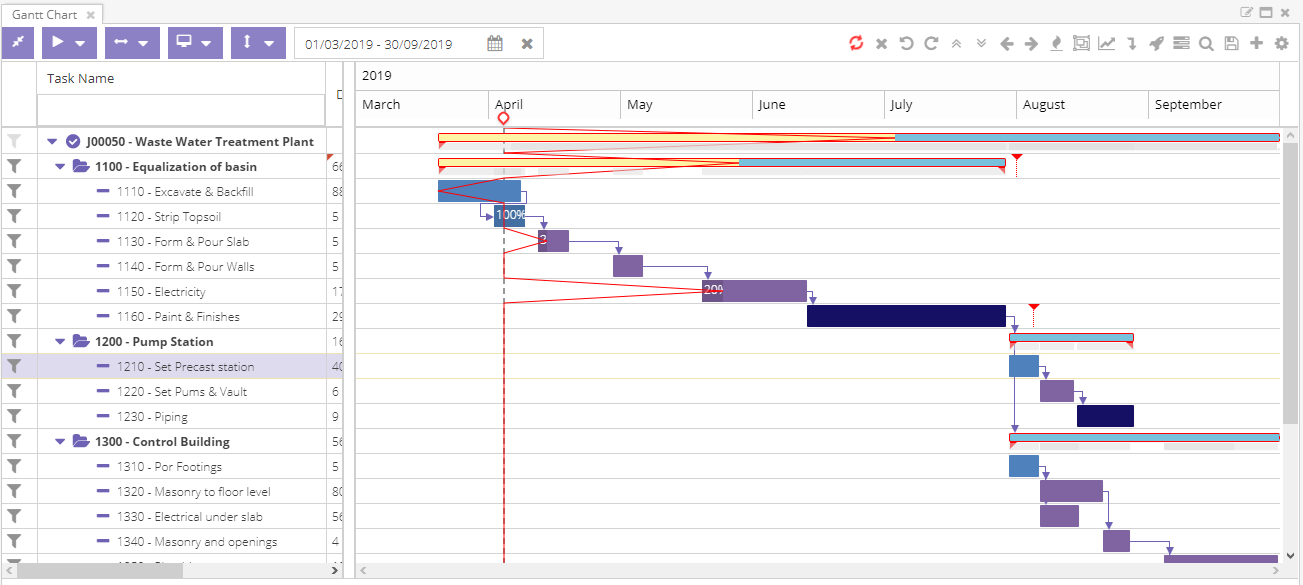
The Gantt chart treats every edit as local: nothing is committed to Dime.Scheduler until the project manager explicitly syncs. This is the whole point of the chart. It gives the manager a sandbox to try ideas, undo them, and only push the result when the plan holds together.
![]()
The synchronization icon goes red the moment anything changes. Click it to commit; click reload to throw the changes away; or use undo/redo for local rollback. Once a project is synced, those changes leave the Gantt's reach, so undo no longer applies.
Moving and editing tasks
Most edits happen one of two places: on the timeline directly, where you can drag a bar to move it, drag its right edge to resize, or drag the small triangle on a selected task to set progress; or in the task editor, which holds the full set of fields.
![]()
The editor's tabs map to the things a project manager actually needs to control:
- General carries the start/end dates, duration, effort, and baseline state. Duration is elapsed calendar time; effort is the hours of work. The two are linked but not equal, and the scheduling mode decides which one drives the other. Painting a room over two 8-hour days alone is 16 hours of both duration and effort. Bring a friend in and the duration drops to 8 hours but effort stays at 16, because two people each worked 8.
- Successors lists what depends on this task. Same data the dependency lines on the timeline encode, just in tabular form.
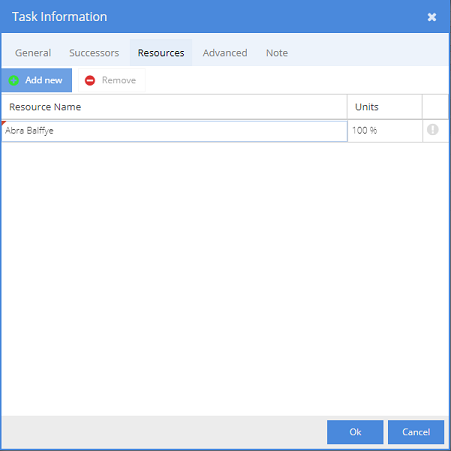
- Resources lists the resources assigned to the work, with the percentage each contributes. See Resources and appointments for how that becomes real planning.
- Advanced is where rollup, manual scheduling, constraints, and scheduling modes live.
- Note is a rich-text scratchpad for anything that doesn't fit a field.
Scheduling mode
The relationship between duration, effort, and resource assignment isn't one-size-fits-all. Four scheduling modes let the project manager pick what stays fixed:
- Normal schedules from start/end dates and the project/resource calendars. Default, and what most project managers expect.
- Fixed Duration locks the start and end and lets effort flex with the resource assignment. A meeting works this way: it lasts an hour regardless of how many people attend, but the total person-hours grow with the headcount.
- Effort Driven locks the effort and lets duration shrink as more resources join. Painting that room is the canonical example: more painters, same total work, less calendar time.
- Dynamic Assignment locks both duration and effort and adjusts each resource's assignment percentage to make the math work. The project manager says "this takes 40 hours over a week and I'm putting three people on it"; the chart figures out the percentage of each person's time that costs.
The Advanced tab also exposes a Manually scheduled flag (which insulates a task from incoming dependencies and constraints) and the per-task Rollup toggle described above.
Dependencies and constraints
Real projects aren't lists of independent tasks. To express "roof goes on after walls", draw a line from the source task's anchor to the dependent task's anchor. A tooltip validates the link as you drag, and the line is rendered with an arrow once you drop it.

Double-click the line (or open the task editor) to set the dependency type (start-to-finish, finish-to-start, finish-to-finish, start-to-start) and the lag, the gap in days between the tasks. Delete the dependency from the task editor, the line's editor, or the task's context menu.

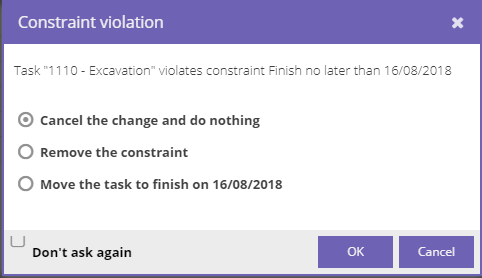
Where dependencies wire tasks together, constraints pin a single task to a date. The Advanced tab offers six flavors: Must start on, Must finish on, Start no earlier than, Start no later than, Finish no earlier than, Finish no later than. Each pairs a type with a target date. If a later edit would break the constraint, the chart prompts: cancel the change, drop the constraint, or move the task to satisfy it.
Splitting tasks
Not every task runs in one continuous stretch. Split a task from the context menu to break the bar into segments, each with its own start and end. Useful when a five-day task is actually two hours every morning for two weeks; the segments are what get materialized as appointments later.
![]()
Working with task groups
The hierarchical breakdown is what makes a Gantt chart manageable at all. A construction project might have a Construction phase, with a Foundation sub-phase, with Excavation and Pour Concrete as leaf tasks. Hundreds of tasks become navigable once they're grouped. The structure also gives the project manager a powerful lever: editing a group cascades down.
Push the start date of a phase out by two weeks because the architect was off sick, and every leaf task in the phase moves accordingly. Where dependencies exist between siblings, they fire too. In the example below the start of the group has moved; without a dependency, only the directly affected task shifts:

With a dependency between the first and second task, the second moves with the first:

The cascade is the feature, but it is also the danger: small changes at the top can rearrange a lot below. Use it deliberately.
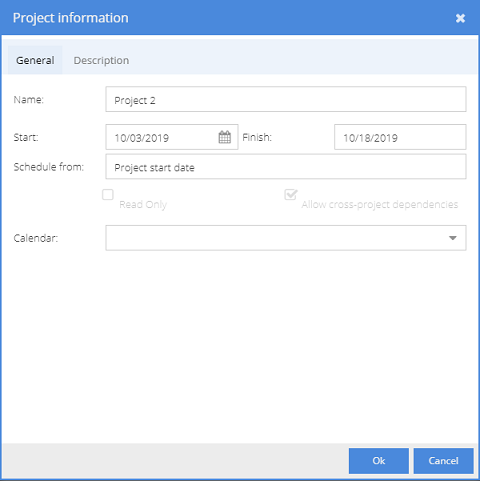
The project itself is the top-most group. You can move the project's start date and the entire tree shifts; you can edit a few project-level fields (start date, calendar, description) but most are managed by the back office.  The icon in the task list distinguishes projects from tasks, and the project editor mirrors the task editor with a tighter set of editable fields:
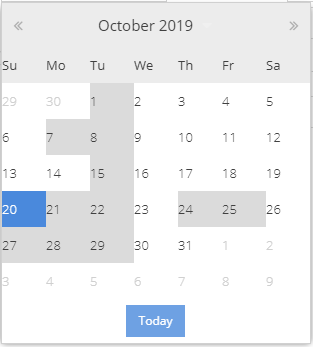
The greyed-out boxes you see when picking a date are non-working days from the project's calendar. Purely informational in the picker; in the timeline itself they affect task duration.
Resources and appointments
The whole point of planning a project is to put real people on real tasks. The Resources tab on the task editor is where that happens: pick resources, set each one's percentage of involvement. A 100% assignment is full-time; 20% is one day a week.
When the project syncs, Dime.Scheduler reads those assignments and creates appointments on the planning board automatically. The conversion takes two inputs: the task's dates (or segments) for the appointment boundaries, and the calendars (project + resource) for the actual hours of work that fit inside those boundaries. A task that nominally runs Monday through Friday becomes appointments only on the days and hours the resource actually works. That is how the project stays an abstract plan while the planning board stays concrete.


Generated appointments carry an anchor icon so the planner knows they came from a project, not from a manual schedule.

Planners can still nudge those appointments on the planning board, but the changes are flagged on the task assignment with a warning icon and a grid of every change.

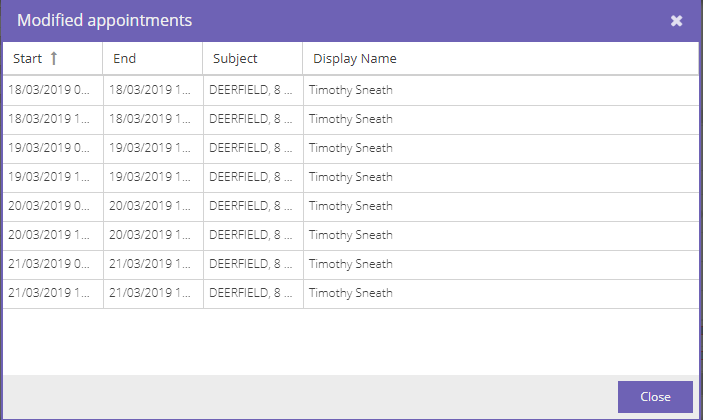
The project manager has the last word. The next sync can override the planner's local edits, with a confirmation prompt to make sure that override is intentional.

Before and after:


Export
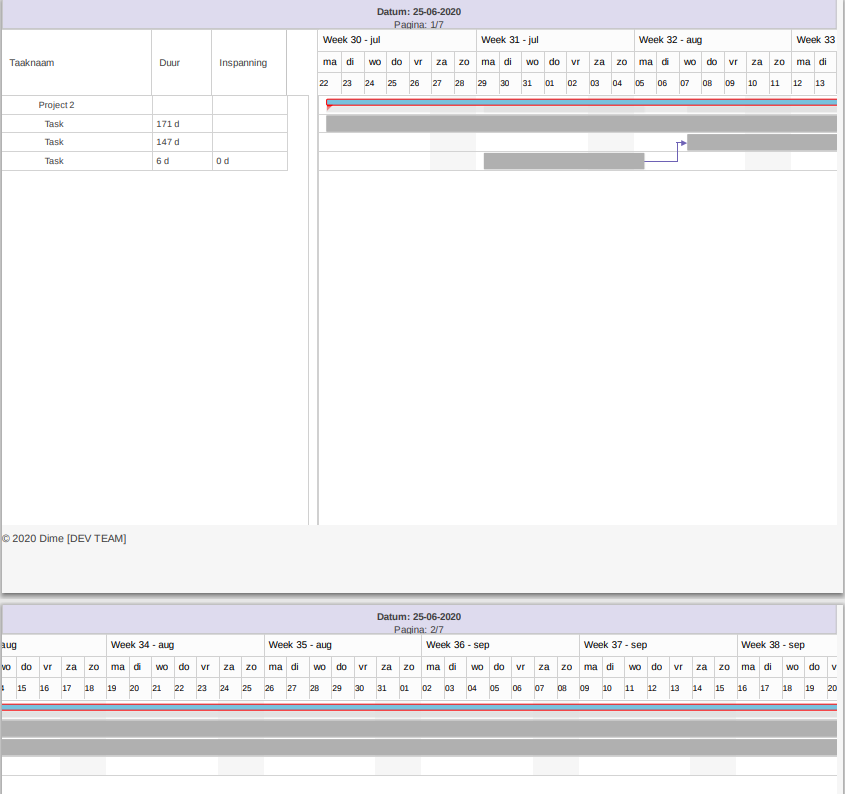
When a project needs to leave the application, a printout for a meeting or a PDF to email, the PDF export button takes a snapshot of the chart and renders it through the export server 1.
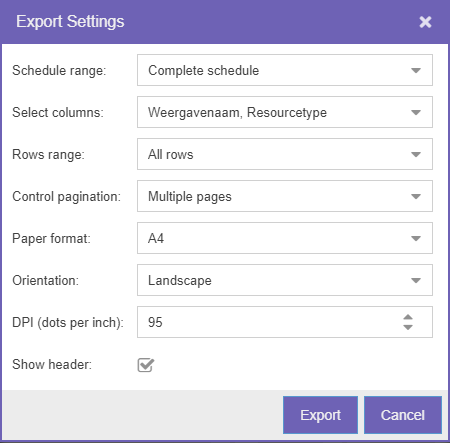
The dialog picks the schedule range (full project, custom dates, or just the visible part), the row range, and the usual print parameters: page format, orientation, pagination, header. Because the export essentially renders the chart as it stands, it helps to maintain a dedicated layout tuned for printing.
Reference
The Gantt chart is stateful: column selection, view, baseline toggle, rollup, and so on are saved as a layout and shared with other users like any other grid.