Progress, attention and health
"Is this task done?" sounds like it has one answer. In practice a project usually has two sources willing to answer it, and they do not always agree.
Somebody reports a task as 80% complete. Meanwhile its card sits in the Done column of the Kanban board. Which one does the project believe?
Dime.Scheduler does not guess. You tell it.
The progress measure
You choose which signal is read as completion. The portfolioPortfolioThe projects page that lists every project in flight as a list, tiles or a timeline, with the health measures that say which project to open next. has a default, set from the settings dialog on the projects page, and each projectProjectA job seen as a whole in project planning: a body of work with a budget, a team, dependencies and a deadline. Its tasks are still planned as ordinary appointments on the board. can choose its own from its settings. Either way it drives both the amber rules and the percentage shown for the project.
| Progress measure | What the project believes |
|---|---|
| Reported % done | The percentage somebody reported against the task |
| Board columns | Where the task's card sits on the Kanban board |
| Both | Both signals, and it tells you when they disagree |
 Choosing the progress measure
Pick the one that matches how your teams actually work. If people diligently report percentages, use that. If they never do but they do move cards, use the board. Choosing a signal nobody maintains produces a project that looks permanently stalled.
Choosing the progress measure
Pick the one that matches how your teams actually work. If people diligently report percentages, use that. If they never do but they do move cards, use the board. Choosing a signal nobody maintains produces a project that looks permanently stalled.
Both is the interesting setting, and it is not simply the cautious middle option. It means the project reads two signals and treats disagreement between them as information rather than noise.
When the signals disagree
With the measure set to Both, a task whose two signals contradict each other is flagged. There are four ways that happens, and they mean genuinely different things:
| Conflict | What it usually means |
|---|---|
| On the board this is done, but the task is still open | The work finished and nobody closed the task |
| Reported 100% done, but the task is still open | Same, reported the other way round |
| The task is closed, but its card never moved to a done column | The task was closed administratively without the board catching up |
| On the board this is done, but the reported percentage is lower | The board says finished, the number says otherwise |
None of these is necessarily wrong. What they all are is a place where the project's two records of reality have come apart, and the value of surfacing them is that somebody decides which is right rather than the project quietly averaging them.
Conflicts only exist under Both. With a single measure there is nothing to disagree with, so those rules flag nothing.
Attention rules
Separately from the progress measure, each project chooses which conditions flag a task as needing attention. This is what fills the Needs attention list on the project's Overview.
| Rule | Flags a task that |
|---|---|
| Overdue | Has passed its end date and is still open |
| Blocked | Sits in a blocked state |
| Waiting on dependency | Cannot start because a task it depends on has not finished |
| Unplanned | Has no appointment on the board |
| Behind | Has reported less progress than the time elapsed would suggest, by more than a gap you set, once enough of its duration has passed |
| Tentative | Is only tentatively planned |
| Inconsistent | Has signals that disagree, as described above |
Set them per project, because the conditions worth flagging differ by the kind of work. An overrun on a fixed-price installation matters in a way it may not on a long research engagement.
Project health
Health rolls up into the color a project shows in the portfolio, and you decide where the lines fall. The thresholds come in two layers. The portfolio's settings dialog sets the defaults for every project on the page, and a project's own settings can tighten them for that project alone.
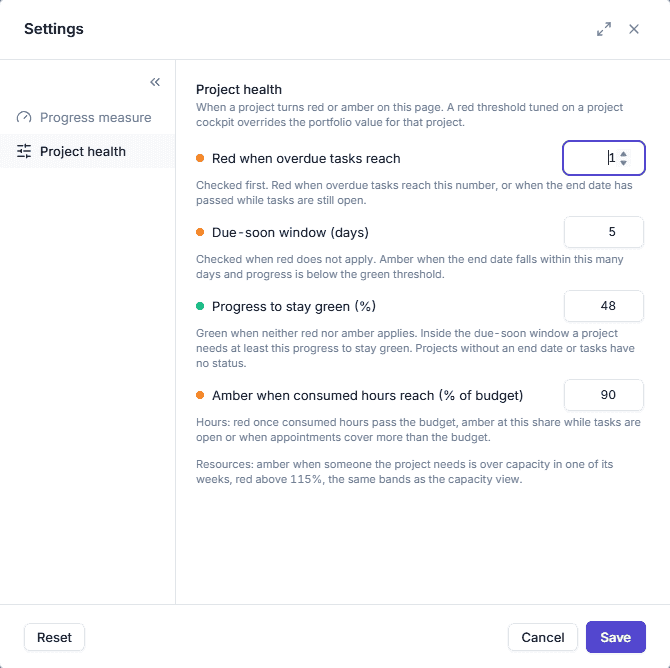 Project health thresholds on the portfolio
The portfolio's schedule rules are checked in a fixed order, and the first one that applies wins.
Project health thresholds on the portfolio
The portfolio's schedule rules are checked in a fixed order, and the first one that applies wins.
| Setting | What it does |
|---|---|
| Red when overdue tasks reach | Checked first. The project turns red once this many tasks are overdue, or once its end date has passed while tasks are still open. |
| Due-soon window (days) | Checked when red does not apply. Inside this many days of its end date, a project turns amber if its progress is below the green threshold. |
| Progress to stay green (%) | The progress a project needs inside the due-soon window to stay green. A project without an end date, or without tasks, has no status at all. |
| Amber when consumed hours reach (% of budget) | The hours measure turns amber at this share of the budget while tasks are still open, or when appointments cover more than the budget. It turns red once consumed hours pass the budget. |
Resources use the same bands as the capacityCapacityThe amount of working time a resource has available in a given period, used to spot over- and under-planning. view: amber when someone the project needs is over capacity in one of its weeks, red above 115%.
A project adds three rules of its own, next to its attention rules. It turns amber once the number of tasks needing attention reaches the figure you set, red once the number of overdue tasks reaches yours, and red when the plan slips past its baselineBaselineThe original plan frozen in the Gantt chart. Shown underneath the current bars, it is how a project manager sees how far the plan has drifted from what was agreed. by more days than you are willing to tolerate.
That last rule is the one worth thinking hardest about, because it is the only one that measures the plan against what the plan originally said rather than against today. A project can have no overdue tasksTaskA unit of work that belongs to a job. It appears in the open task list until it is scheduled to a resource. and no flagged ones and still have quietly moved two months to the right. Every individual deadline was renegotiated in good faith, each time for a good reason, and nothing ever looked wrong. The baseline, which is set from the Gantt chart, is what catches that.